Bulked Segregant analysis
Service Advantages

Takagi et al., The plant journal, 2013
● Accurate localization: Mixing bulks with 30+30 to 200+200 individuals to minimize background noise; non-synonymous mutatants-based candidate region prediction.
● Comprehensive analysis: In-depth candidate gene function annotation, including NR, SwissProt, GO, KEGG, COG, KOG ,etc.
● Faster Turnaround time: Rapid gene localization within 45 working days.
● Extensive experience: BMK has contributed in thousands of traits localization, covering diverse species like crops, aquatic products, forest, flowers, fruits, etc.
Service Specifications
Population:
Segregating progeny of parents with opposing phenotypes.
e.g. F2 progeny, Backcrossing (BC), Recombinant inbred line(RIL)
Mixing pool
For qualitative traits: 30 to 50 individuals(minimum 20)/bulk
For quantitative tratis: top 5% to 10% individuals with either extreme phenotypes in the whole population(minimum 30+30).
Recommended sequencing depth
At least 20X/parent and 1X/offspring individual (e.g. for offspring mixing pool of 30+30 individual, sequencing depth will be 30X per bulk)
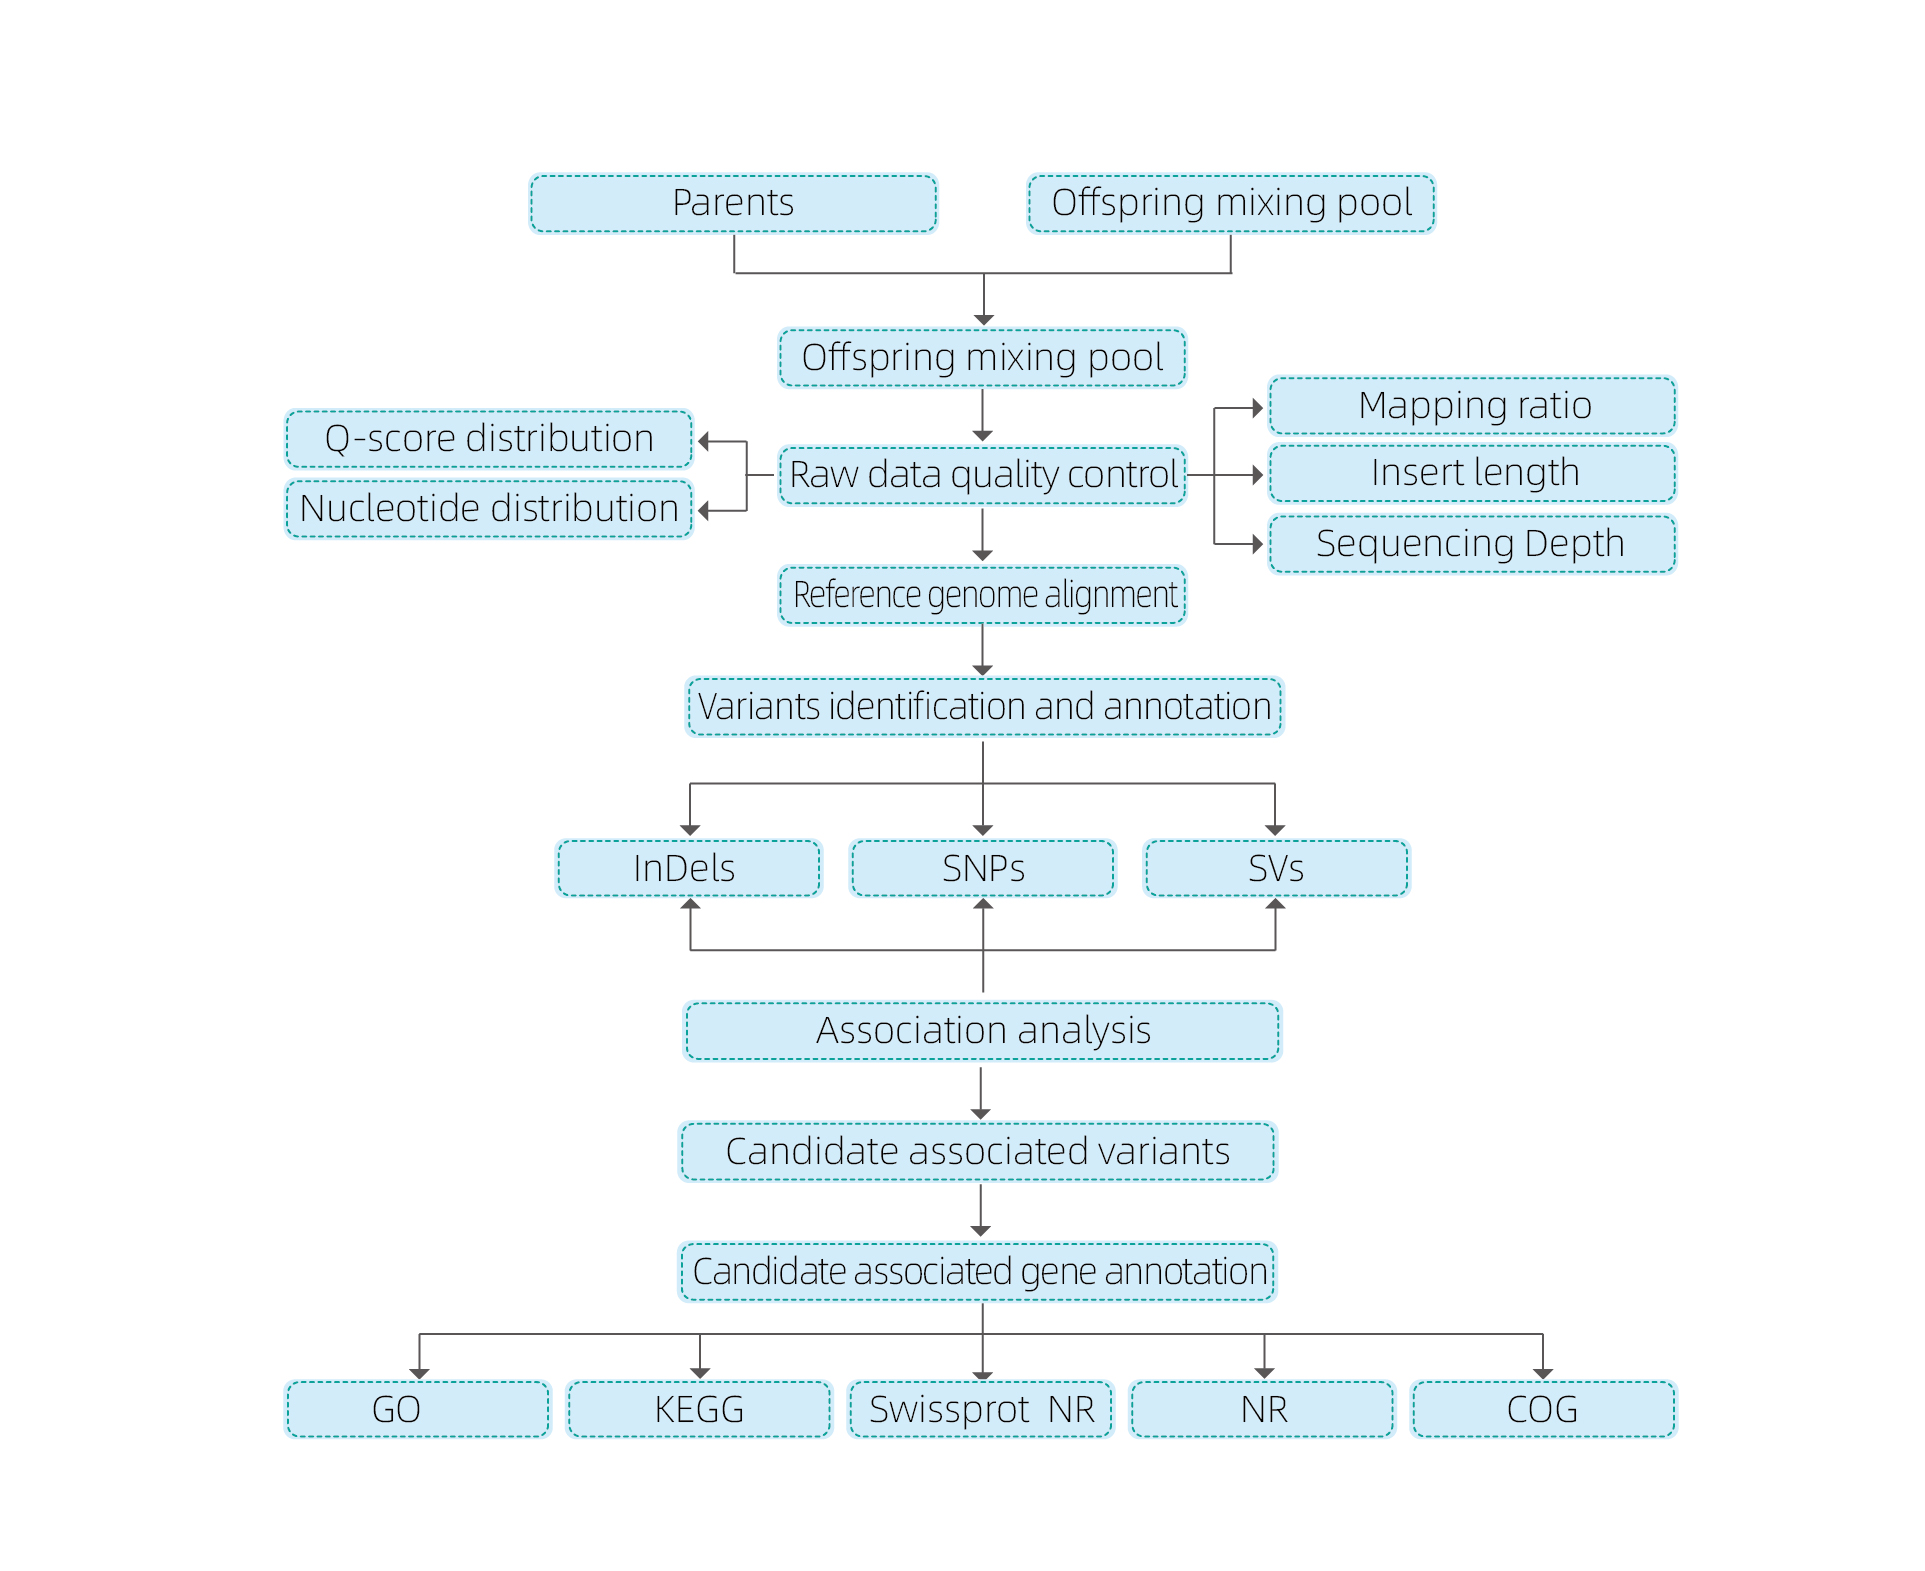
Bioinformatics analyses
● Whole genome resequencing
● Data processing
● SNP/Indel calling
● Candidate region screening
● Candidate gene function annotation

Sample Requirements and Delivery
Sample Requirements:
Nucleotides:
|
gDNA sample |
Tissue sample |
|
Concentration: ≥30 ng/μl |
Plants: 1-2 g |
|
Amount: ≥2 μg (Volumn ≥15 μl) |
Animals: 0.5-1 g |
|
Purity: OD260/280= 1.6-2.5 |
Whole blood: 1.5 ml |
Service Work Flow

Experiment design

Sample delivery

RNA extraction

Library construction

Sequencing

Data analysis

After-sale services
1.Association analysis base on Euclidean Distance (ED) to identify candidate region. In the following figure
X-axis: Chromosome number; Each dot represents an ED value of an SNP. The Black line correspond to fitted ED value. A higher ED value indicates a more significant association between the site and the phenotype. Red dash line represents threshold of significant association.

2.Association analysis based no SNP-index
X-axis: Chromosome number; Each dot represents SNP-index value. The black line stands for fitted SNP-index value. The larger the value is, the more significant the association is.

BMK Case
The major-effect quantitative trait locus Fnl7.1 encodes a late embryogenesis abundant protein associated with fruit neck length in cucumber
Published: Plant Biotechnology Journal, 2020
Sequencing strategy:
Parents (Jin5-508, YN): Whole genome resequencing for 34× and 20×.
DNA pools (50 Long-necked and 50 short-necked): Resequencing for 61× and 52×
Key results
In this study, segregating population(F2 and F2:3) was generated by crossing long-neck cucumber line Jin5-508 and short-neck YN. Two DNA pools were constructed by 50 extreme long-neck individuals and 50 extreme short-neck individuals. Major-effect QTL was identified on Chr07 by BSA analysis and traditional QTL mapping. The candidate region was further narrowed down by fine-mapping, gene expression quantification and transgenic experiments, which revealed key gene in controlling neck-length, CsFnl7.1. In addition, polymorphism in CsFnl7.1 promoter region was found to be associated with corresponding expression. Further phylogenetic analysis suggested that Fnl7.1 locus is very likely to be originated from India.

QTL-mapping in BSA analysis to identify candidate region associated with cucumber neck length |

LOD profiles of cucumber neck-length QTL identified on Chr07 |
Xu, X. , et al. “The major-effect quantitative trait locus Fnl7.1 encodes a late embryogenesis abundant protein associated with fruit neck length in cucumber.” Plant Biotechnology Journal 18.7(2020).
